
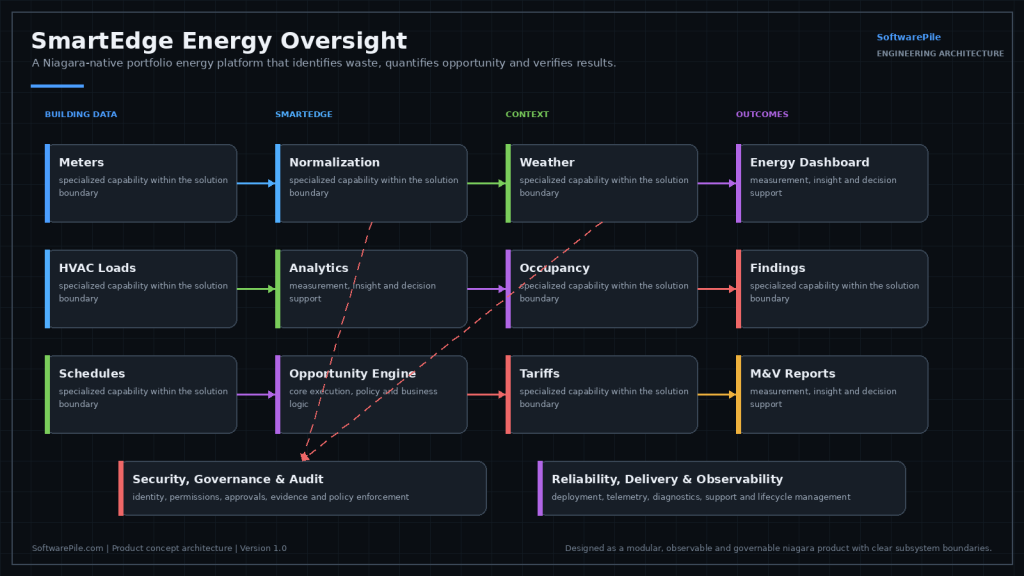
Most energy dashboards show you consumption. Very few tell you which of it was avoidable, what fixing it is worth, or whether the fix actually worked. That gap is why energy projects stall after the first report — there is data, but no defensible list of actions.
Status: product concept, in active development. This is something we are building, not something you can buy today. We publish our roadmap because the engineering thinking behind it is the useful part — and because we would rather show you the design than imply a finished product.
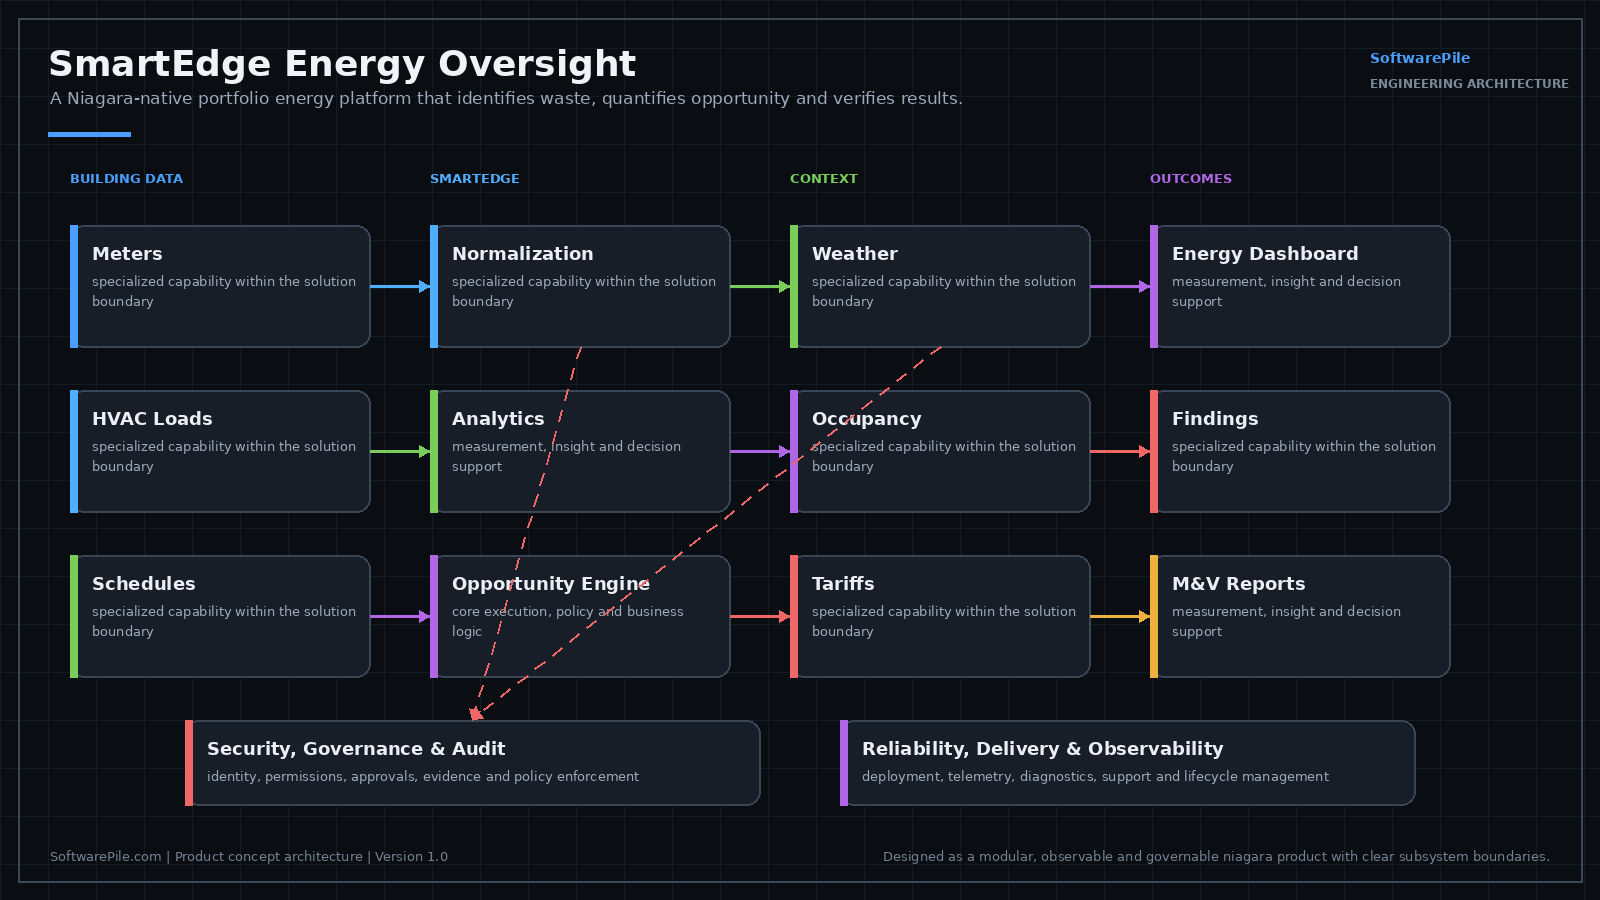
Designed Capabilities
- Meter and utility normalization — make sites comparable before drawing conclusions.
- Weather and occupancy context — a cold month is not a performance regression.
- Base-load and after-hours analysis — what the building consumes when nobody is in it.
- Peak-demand and tariff analysis — where the bill is shaped by demand rather than usage.
- Scheduling and simultaneous-operation detection — heating and cooling fighting each other.
- Energy-use intensity benchmarking — portfolio comparison that survives scrutiny.
- Savings opportunity prioritization — ranked by value and effort, not alphabetically.
- Measurement and verification reporting — prove the saving persisted.
Verification Is What Makes It Credible
Anyone can produce a list of energy opportunities. The hard part — and the part that gets the next project funded — is showing that a change made last quarter is still delivering. Building measurement and verification into the product rather than treating it as a consulting deliverable is the deliberate choice here.
Tell us if this matches a problem you have — early input shapes what we build first, and we will give you an honest view of where it stands.
Related services
- Niagara Graphics and Operator Dashboards — Energy data has to be readable to be useful: Niagara graphics and dashboards.
Where This Product Stands
SmartEdge Energy Oversight is in development. It cannot be bought, licensed, or subscribed to today, there is no release date, and this page describes a design that is still moving. There is no completed engine behind it that anyone could be given access to. Where a portfolio energy question needs answering now, the route is a consulting engagement scoped as a service, which is separate work and is listed as such on the Solutions in Development overview.
The name refers to where the data comes from, not where the computation would run. Metering capture and local buffering belong at the edge. Analysis over months of history belongs off the controller, for the reasons Technologies sets out.
First Question: Does the Data Support the Question Being Asked?
Energy analysis is limited by metering coverage long before it is limited by analytics. A site with a single utility meter can support base-load and after-hours analysis, because those depend on the shape of the load curve. It cannot support equipment attribution, because nothing in the data distinguishes the chiller from the lighting.
Interval resolution matters just as much. Monthly bills answer questions about trend and tariff. Peak demand behavior and scheduling faults need interval data, and where that data does not exist yet, connecting submeters is the first piece of real work. Modbus covers what that metering integration involves in practice.
Normalization Is the Part That Decides Credibility
Raw comparison between sites misleads unless the differences between them are accounted for. A colder month raises consumption without anything degrading. An office floor and a room full of servers have no business being compared on energy use intensity without adjustment. Operating hours, conditioned area, occupancy and weather all have to enter the calculation before a ranking means anything.
The design intent is that every number a report shows can be traced back to the inputs and the adjustment applied. A finance director who cannot see how a figure was derived is right to distrust it, and a single unexplained number is enough to put the rest of the report in doubt.
What Verification Demands From the Design
Measurement and verification, in the sense that published frameworks such as IPMVP set out, depends on three things that have to be designed in from the start: a baseline period recorded before the change, a reliable record of what changed and when, and the ability to re-run the identical calculation months later. Software Pile holds no certification against IPMVP and claims none. The framework is named here because it is the reference finance teams recognize, and a formal savings determination needs a qualified practitioner alongside whatever tooling is used.
The middle item is where projects come apart. If nobody can say precisely when a schedule was altered or a setpoint moved, the savings claim rests on memory. That is a large part of why the Niagara Station GitOps and Change-Control Platform concept sits alongside this one in the Solutions in Development set.
What It Is Not Meant to Do
It is not a tenant billing system. Revenue-grade billing carries metrology and legal requirements that an analytics layer should not pretend to satisfy.
It is not a substitute for metering work. Where meters are absent, the answer is meters and integration, and the product would only report the gap.
It is not intended to write to control. Analysis that recommends and a control layer that acts are separate responsibilities, and combining them in a first release would be the wrong call. Findings are meant to become work orders and engineering changes made deliberately.
Frequently Asked Questions
What is SmartEdge Energy Oversight, and what is it not?
It is designed as an analytics layer that reads from a Niagara station, not a driver or a protocol stack. It is not a replacement for Workbench or for a Supervisor: engineering, alarming and graphics stay where they are, and the product would consume what those tools already record rather than take over any part of their job. Because the analysis is designed to sit outside the control loop, a failure in it, whether that is wrong output, a slow query, or a server that is down, has no path to affect plant operation. What it would produce is analysis that people read and act on, not a station component that has to be commissioned into a sequence.
What has to already exist in a station before there is anything to read?
Points have to carry history, not just live values. A numeric point that updates on change of value tells you what it is doing now and leaves nothing behind to work with later; a history extension configured to log on an interval rather than on change is what produces the record. Meters need particular care, because a kWh register is a totalizer: the useful configuration is a fixed-interval sample that is differenced afterward, and the differencing has to survive a counter that rolls over or is reset, which appears in the data as a negative delta. Network access is the other half, with BACnet/IP on UDP 47808 and Modbus TCP on 502 the usual paths to metering, and the firewall rules for them are a customer-side decision. Clock sync matters more than people expect: a JACE running a few minutes off a common time source will smear a 15 minute demand interval across two buckets and make two sites look different when only their clocks were.
How is a rollout designed to proceed?
The first work is in the station, not in the analysis. Equipment and points have to be named and tagged so that a chiller reads as a chiller at every site: tag dictionaries and the tags applied to equipment let a query identify equipment class without a person reading each point name, and a BQL query against a tagged hierarchy can select every point of a class in one pass. Where that structure does not exist, the fallback is string matching against names written by different engineers in different years, or a hand-maintained mapping table that has to be corrected every time a station is edited, which is where cross-site rollups quietly go wrong. The design assumes one site is taken end to end before a portfolio, because naming conventions that look consistent in a spreadsheet are usually less consistent in the stations themselves.
Where is the history supposed to live? Can a JACE hold it?
Do the arithmetic before answering. One point logged every 15 minutes is 96 records a day and roughly 35,000 a year, so a site with a few hundred metering and equipment points is generating millions of records a year before anyone asks a question of them. Controllers are sized for control, and their storage and query capacity is not where several years of interval history belongs, which is the arithmetic behind keeping the computation off the controller: histories archive to a Supervisor or to a database, and the design reads the archive. Where the meters themselves are missing, closing that gap means current transformers and meter installation on live electrical gear. That is physical scope, separate from anything the software does.
How is it designed to fit with the systems a site already runs?
Read-only, against history that already exists. The station-side work is configuration, meaning history extensions, tags and a read account, rather than any change to control programming, so the sequence a site runs today is designed to be untouched. Reading archived history instead of polling live points also keeps field trunks out of it, which matters most on BACnet MS/TP, where the trunk is a shared token-passing bus at a fixed baud rate and any added polling competes with the controller's own traffic. Downstream, output is designed to leave as documents and exports rather than as a system of record, so it is not something other systems have to be integrated into.
Who would hold the data, and what stays under the customer's control?
Since nothing is running, no data has anywhere to go yet, and that is worth stating plainly: this cannot be deployed today, so where the analysis would execute and where a history copy would sit are open questions rather than settled ones. The design intent is that the station and its archive remain the customer's system of record, and that the product reads a copy rather than becoming the place the data lives. Access on the Niagara side is designed to be a station user with read permission on history, not an admin account, and the customer decides whether that account exists, what it can see, and when it stops working. Whether analysis would run on customer-hosted infrastructure or elsewhere is meant to be a per-customer decision, not something the design forces.
What does the customer have to supply or decide?
A site list, and a definition of what counts as one site, because a campus behind a single utility meter and a separately metered building are not the same unit of analysis. A floor area figure and the basis it is measured on, since gross and conditioned area give different denominators and an energy use intensity ranking is only comparable when every site used the same one. Operating hours including the exceptions people forget, such as second shifts, weekend runs and holiday shutdowns. The rate schedule as written, with its demand window, time-of-use periods and any ratchet clause, because a demand charge that ratchets off an annual peak behaves nothing like one billed on the current month. And whoever authorizes the read account and the firewall rules on each network.
What about energy data that never passes through Niagara?
A good deal of it will not. Utility interval files, a meter data management system and monthly bills all carry readings that no station ever sees, and the design treats them as another input rather than a special case: a reading needs a timestamp, a unit and a meter identity to be usable, and anything else is context that can be attached afterward. The awkward part is alignment rather than format, because a utility's interval boundaries and time zone handling, including how a file expresses daylight saving transitions, have to be reconciled with the way station history was recorded before the two can be compared at all.